Interpreting results
Lecture 17
2024-06-13
Logistics
- Three classes left! We’re almost there… :)
Wrapping up the project
- Project component 3: submit for grading by next Monday (June 17)
Final paper
- use (revised!) elements of your proposal, descriptive stats, and results to turn your question and analysis into a (concise) paper.
- More detailed instructions and example will be posted soon
- Due Monday, June 24, 11:59pm
Final presentation
- Short! ~5-10 minutes
- Briefly introduce your question, say a bit about why it’s interesting, show your results, and talk about what you conclude from them.
- Tuesday, June 20
Today
- Interpreting results!
The (approximate) data analysis process
- Determine topic ✓
- Find data; learn what observations and variables are available ✓
- Write research question ✓
- Describe distributions of relevant variables ✓
- Prepare data frame for analysis ✓
- Describe relationships between variables ✓
- Perform statistical tests ✓
- Communicate results
So you have a p value…
- Rejecting/failing to reject hypotheses is useful
- But it’s also statistics-speak, not effective communication
What do you want to be able to say?
- Something about what the world is like!
- Translate back from hypothesis test language—zoom back out. If you were describing your results to a friend, what would you say you learned about the world?
What can’t we say?
- Knowing the limitations of your conclusions is super important!
- Limitations can arise from several places.
Sampling and generalizability
- Who can your results speak to?
- Is your sample big enough?
- Was it selected randomly?
Accuracy
Are people likely to give you accurate answers?
Unintentional inaccuracies
- Desirability biases
- Memory problems
Misrepresenting/lying
- Is your data coming from something or someone who has a stake in it?
Saying vs doing
- What people say is often different than what they do
- Stated ideals often don’t match up with actions
- “I believe in equality but I oppose all the policies that would create it”
- Did your data collect information on saying, or on doing?
- Avoid drawing conclusions about what people would do when the data you have is about what they say
Operationalization
Are the questions and categories what you would like them to be?
Do we lose information through bad category choice or bad documentation?
For example: bad but common operationalizations
- Race: white or nonwhite
- Gender: male or female
Causality
- Association vs causation: What’s the difference?
- Association: two things are related
- Causation: one thing drives another thing
- It’s nice to be able to say something about causation, but it’s hard!
- Hypothesis tests speak to association. They sometimes speak to causation as well—it all depends on the set up of your study!
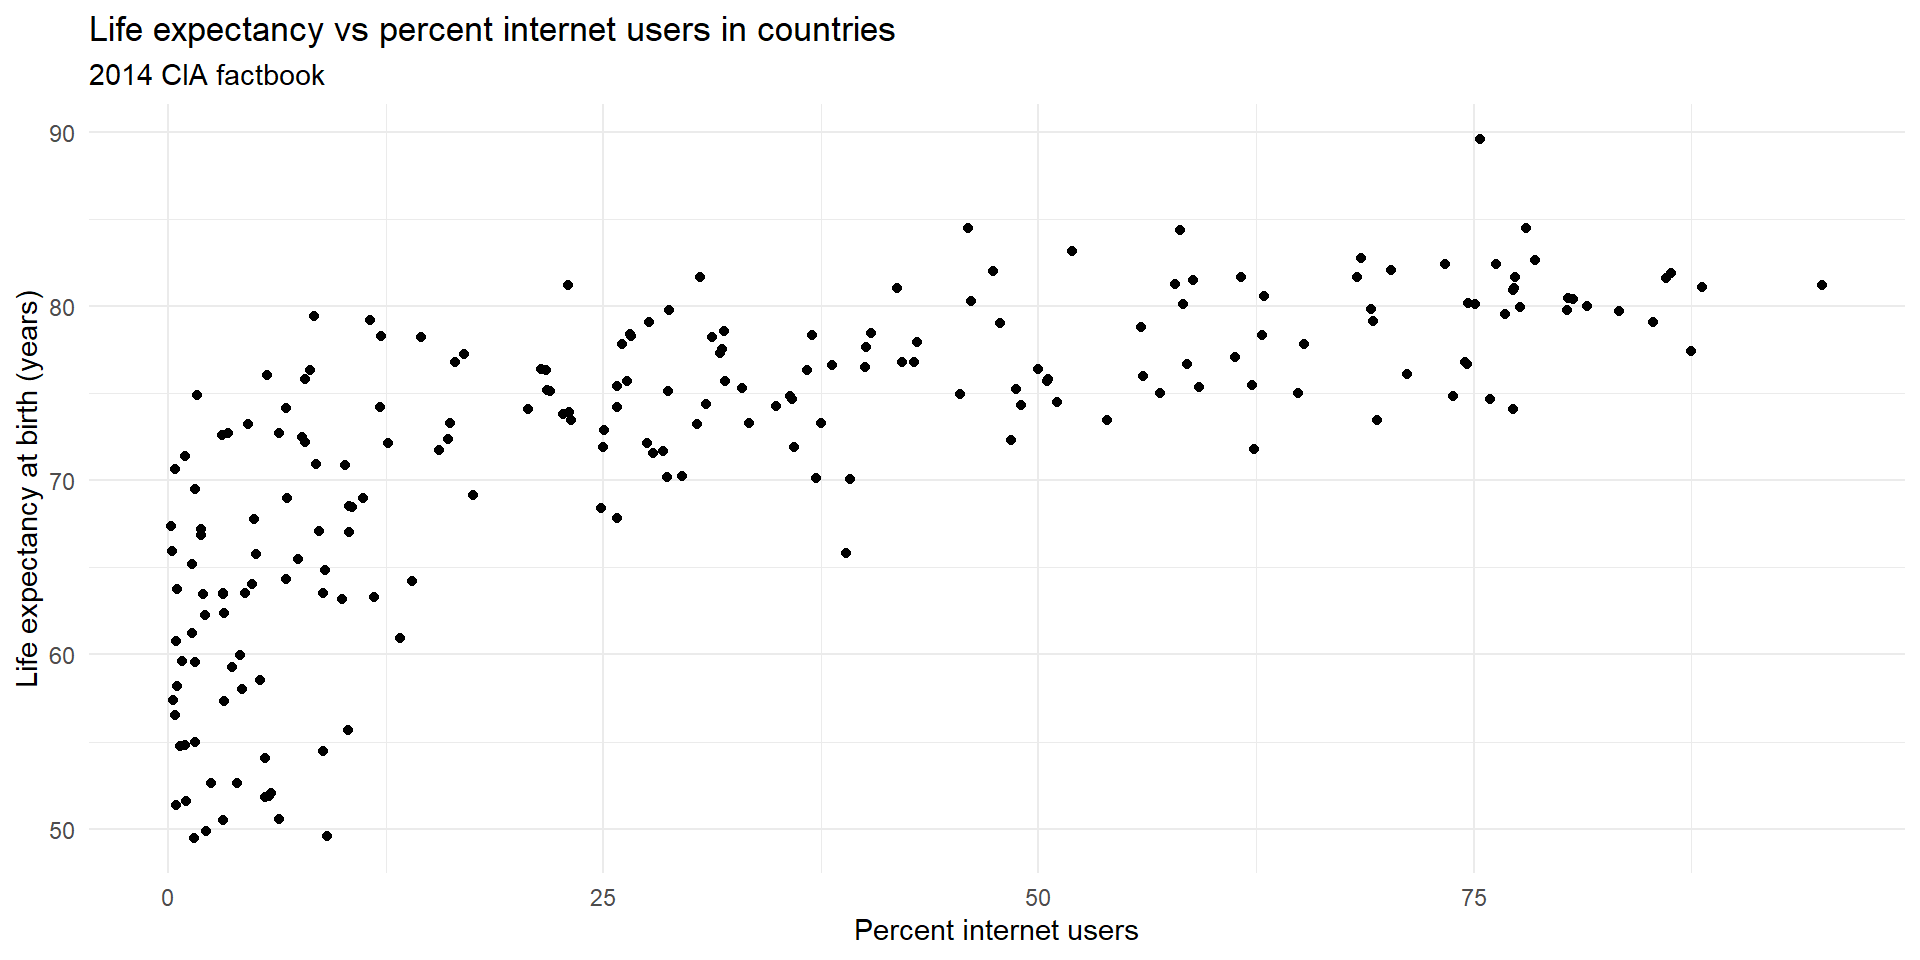
Exercise Q1
- Does this provide evidence that using the internet helps people live longer? Why or why not?
- Write down a plausible explanation for this relationship.
Workshopping results
Teams
Same as last time: you have access to each other’s repos on GitHub. Leave your feedback as an issue. Questions to address are at the top of the instructions page on the website (link).